
GooBiz is a consultancy and training company providing Digital Transformation & System Engineering services across NA, EMEA and currenty all other locations including Asia-Pacific in distance training and consultancy
Putting into Practice the 'Strategic and Data-Driven Agile Value Delivery'
Making the Open Agile Value-Development (TM) "Actionable" to enable Effective Decision-Making
As the pace of digital disruption is dramatically continuing to increase, companies need more than ever before to create 'Innovative Values' being driven by the right "Data" provided at the right time.
Enabling different business units with such a Data-Driven Decision-Making in coherence with Enterprise Goals, Outcomes and Strategies requires a top-down and bottom-up impact analysis. The latter helps to deal rapidly and cost efficiently in adapting services and products to disruptions of their business environment and adjust the 'Value Delivery' based on Customer Experience for greater customer satisfaction.
In this perspective of the 'Agile' Value Development', the Open Group has recently issued the new standard : Open Agile Architecture (O-AA) that aims to create Value in an Agile way by aligning Products, Services and Operations to Enterprise Strategies, Experience Design and Value Streams being provided by Data captured through drivers such as the Customer Journey.
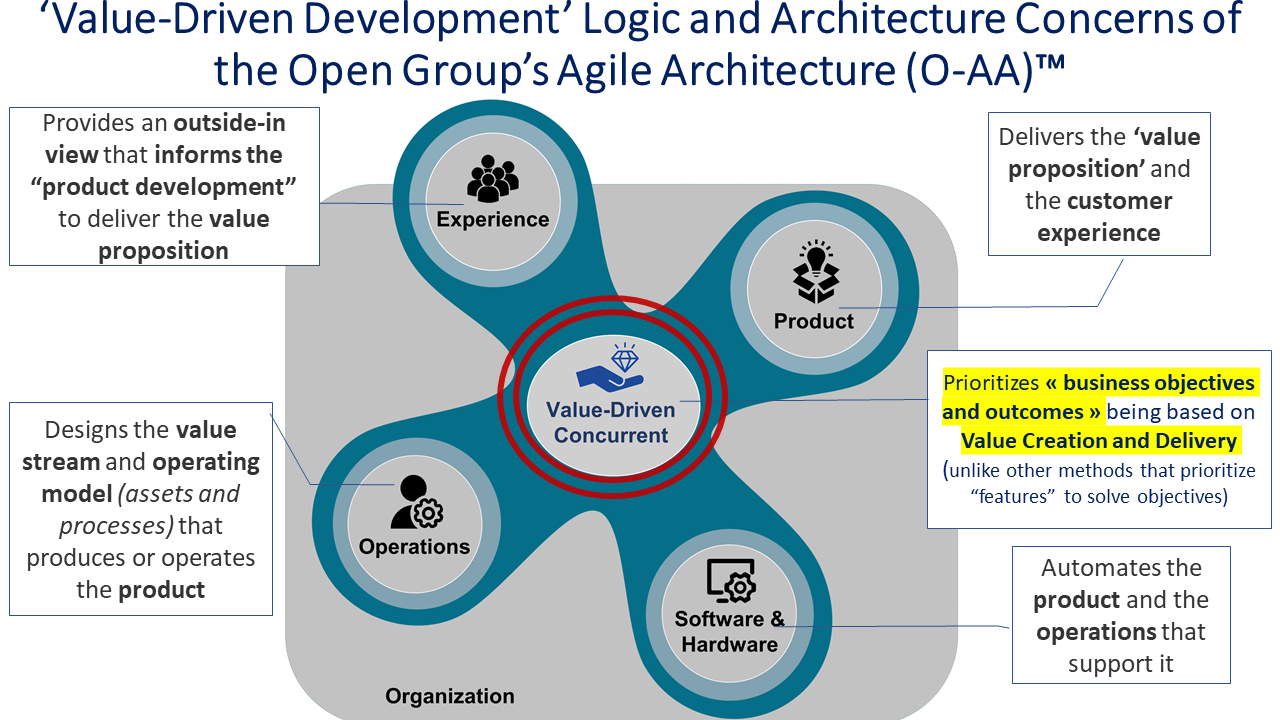
As depicted in the figure below, O-AA is centered around the concept of "Value" instead of 'Requirement based features'.
In the summary presentation below, you can see on the left a short explanation for each concern (Experiences, Product, Operations etc..) and the corresponding building blocks on the right complemented by two arrows (Strategy-Driven Value Creation and Data-driven Value Adjustment).
TM.png)
Figure 1 - Concerns and Building Blocks of the O-AA's Value-Driven Development
On the top of these building blocks, the strategy building block helps to define 'desired states' and drives 'Values' to be delivered (placed in the centre).
Under the strategy building block, two perspectives appear to underpin the latter. These are the "Experience Perspective" and "Work System Perspective" whose building blocks are driven by "Value".
The Experience Perspective "places customer needs and problems at the centre" while the Work System Perspective defines the "ability of the enterprise to deliver the client benefits by architecting the operating model".
Coming back to the Strategy building block, it defines the "real strategy" as making "hard-to-reverse choices about how to win" and focuses on "bending the law of unintended consequences " to improve the outcomes of hard-to-reverse decisions !. 'Contextual Value Creation' by test driving decisions on a scenario basis appears there as an inevitable enabler of decision-making. It allows to respond to "what value to deliver" in which scenario of courses of actions (long term strategy or short term tactic).
In this perspective, Agile Strategists can make use of the 'Design Thinking Process' (DTP) - a "human centered" innovation process used in creative problem solving through the lens of the customer.
DTP allows strategists to discover and formulate the big problems that challenge the enterprise by incorporating human cognition and emotion as key aspects of the "value definition" as depicted on Making_The_Agile_Value_Driven_Architecture_Actionable.
The Design Thinking also needs to consider separately the problem space from the solution space. This is to allow 'delivery of the right value' as originally considered at the problem space by envisioning all potential innovative solutions (cf. § Using Innovation Dimensions to support "Value Creation").
Upon the usage of "Data" from 'Strategy' to Operational Work Systems
As also mentioned in the "Agile Strategy Tenets" of O-AA, strategy formulation based on the world of market studies and operational/financial numbers "must be completed by real-world experience" - (so need to be supported by strategic and underlying operational data).
In other words, the model of the world provided by "marketing data" requires to be fine-tuned using other "value creation data" that can be obtained by visiting places where differentiating value can be created using client interactions or delivery places of products and services (cf. entities of innovation dimensions next).
To ensure such a 'Value-Driven' approach, all building blocks require to be underpinned by Data / Information & AI enabled insights that have to be realized by Software and Hardware Architecture.
Therefore, in order to enable the 'Strategy' to appropriately operate on the architecture and plan delivery of the right Values, the Strategy building block also needs to be covered at least by "data, information and Value" (cf. figure O-AA Building Blocks).
Such an extension becomes necessary to provide Strategy with the necessary 'data and information' to plan delivery of coherent values based on potential insights. This aspect is detailed further (cf. § 'Orchestrating the 'Value Creation and Delivery').
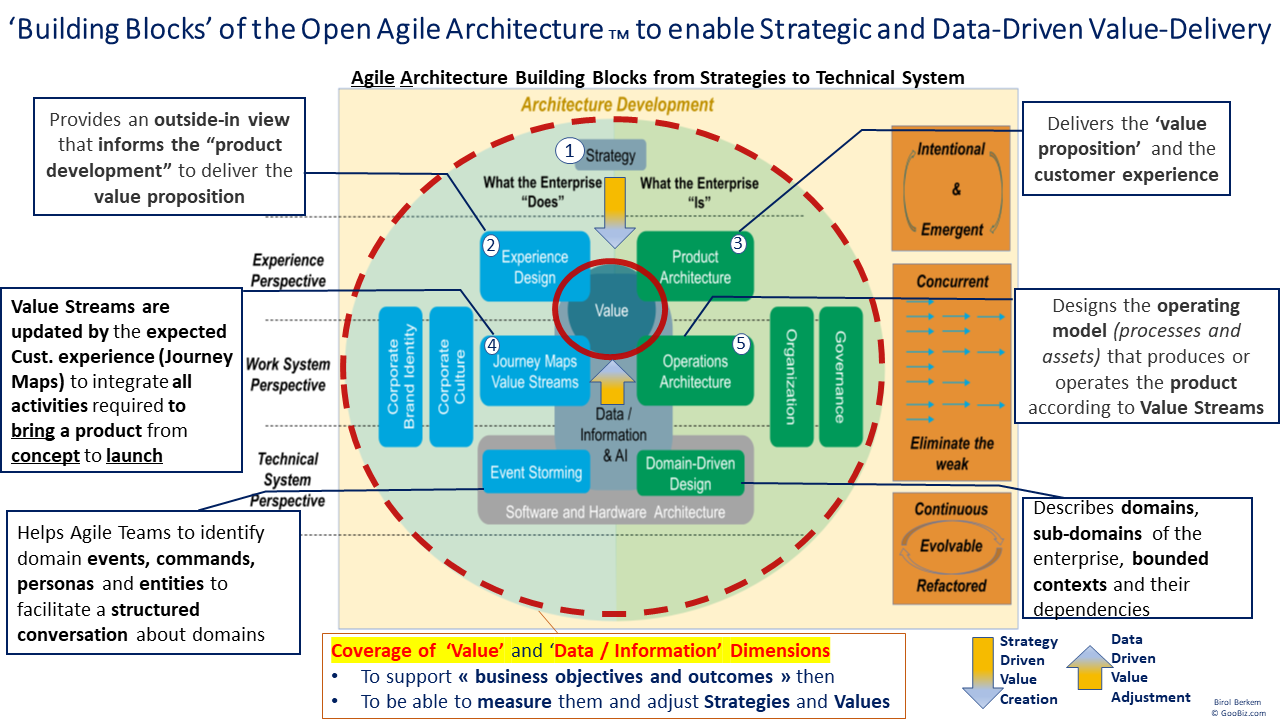
Figure 1.1 - A summary presentation of the O-AA's Value-Centred Building Blocks
Value-Driven Development and Innovation Dimensions
O-AA states that the Value Creation process needs to be "framed" by a continuous enhancement of the 'Value' definition as also highlighted by the O-AA building blocks development logic.
To do this, the Value-Driven Development needs first to consider "Drivers" that fuel the change to the organization then continue through steps of the Customer Journey where the value is delivered.
Then based on "insights" aligned to strategy and derived upon analysis of user feedbacks including performance data captured from IoT devices, the Value Creation Process needs to adapt the 'value delivery' to changing needs of consumers and the organization's disrupting environment.
In this perspective, insights that are derived based on data and information analysis have the responsibility to make the organization goals and underlying values "actionable" in order to create more adjusted values essentially in face of the emerging needs of consumers and changes captured from the market or regulations, ...
To ensure this, insights need to be closely tied to motivational elements (goals, outcomes, ...) and the strategic elements of the architecture such as value streams, courses of actions, capabilities.
On the other hand, 'Creation and Delivery of Value’ needs to be supported by the Innovation Dimensions of a Value such as Processes, Resources, Delivery Channels etc... to delight users and consumers through steps of their Customer Journey where captured feedbacks help to adjust the ongoing strategies.
Before focusing on the architectural aspects that enable the Value Creation, its Delivery and Enhancement, we start below with an introduction slide that makes a summary of facts observed about the Innovation and its Dimensions. This first slide introduces main ideas from the '12 Different Ways for Companies to Innovate' and also the definition of Value based on ArchiMate, the modeling language standard for Enterprise Architecture.

In addition, as mentioned in paragraph 4.2.3 of the O-AA specification, "In the digital age, value cannot be reduced to functional benefits. Therefore, its definition includes emotional dimension; for example, providing fun, or a sense of affiliation".
"The central idea is to provide benefits to clients and other stakeholders at the lowest reasonable cost.
The value of a product can be increased either by maintaining its functions and features while reducing its cost, or by keeping the cost constant while increasing the functionality of the product".
Making Use of Innovation Dimensions to Configure the "Value Creation"
To ensure a quick understanding of the Dimensions of "Business Innovation" that are used in supporting "Value Creation" and making these Values "Actionable", we located them below through the partitions of the Business Model Canvas (BMC) as the latter may initially be used as a candidate framework to describe these dimensions with their particular relationships.
The Lean Model Canvas also offers an alternative to locate Innovation Dimensions as it includes two other compartments to describe 'Customer Problems, potential 'Solutions' and 'Key metrics'.
However, none of these canvases or languages offer on their own sufficient coverage to structure the creation and delivery of value, being based on goals and strategies until the Steps of the Customer Journey and to make them actionable.
The OMG's Business Motivation Model (BMM) partly fulfills the upperside role starting by Influencers to go through Asessments, Goals, Objectives, Policies, Stategies, Tactics,... that are used to guide and govern Business Processes.
As a good enabler of essential parts of the BMM, the Open group's ArchiMate standard offers a graphical language supported by a layered architecture. The latter enables requirements gathering from Drivers (Influencers in BMM) and Goals, Outcomes until Strategies, Processes, Application and Technology Architectures... in a structured way and enables in its last version 3.1 modeling of Value Streams through its stages.
Value Streams describe the entire value proposition for any stakeholder (customers or internal stakeholders) of an organization by the use of specific "value items" and serves as a strategic guide for its operations.
In this perspective, the figure below depicts the '12 Innovation Dimensions' on the left and an initial representation of these dimensions located through the partitions of the Business Model Canvas (BMC) complemented by Goals, Outcomes and Value Stream Stages (from ArchiMate).
Value Items that are created there by the Stages of Value Stream help to strategically describe Value Propositions that, in turn, need to be directly supported by dimensions shown in the Model Canvas such as Processes, Platform of Resources, CX and Distribution Channels.
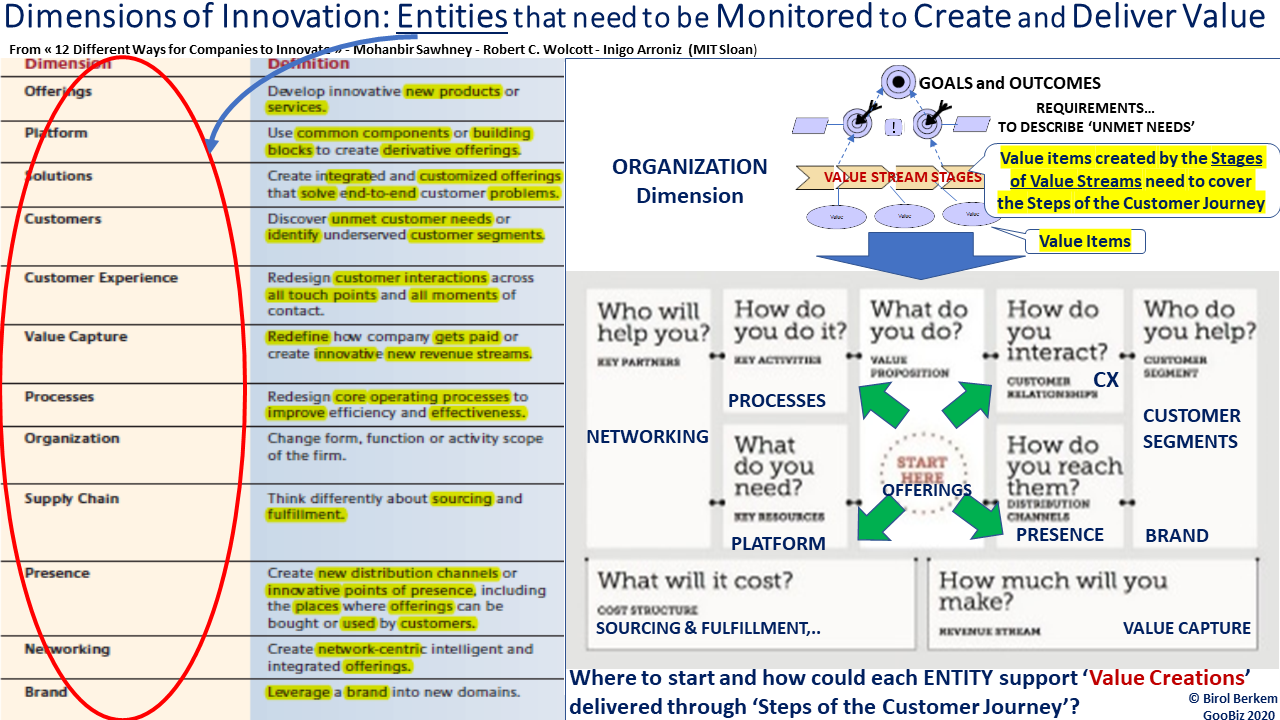
Figure 2 - Innovation Dimensions from "The 12 Different Ways for Companies to Innovate (MIT Sloan)" on the left. Their location as "Strategic Entities to be monitored" within the partitions of the Business Model Canvas (BMC) being driven by Goals, Outcomes and Value Streams.
An extended representation of these 'Innovation Dimensions' is provided below to focus on the role of each "Innovation Entity" through partitions of the BMC with some enhanced suggestions.
Products and services that support the 'offerings' will be presented further in the perspective of "Product Architecture" to support the value propositions.
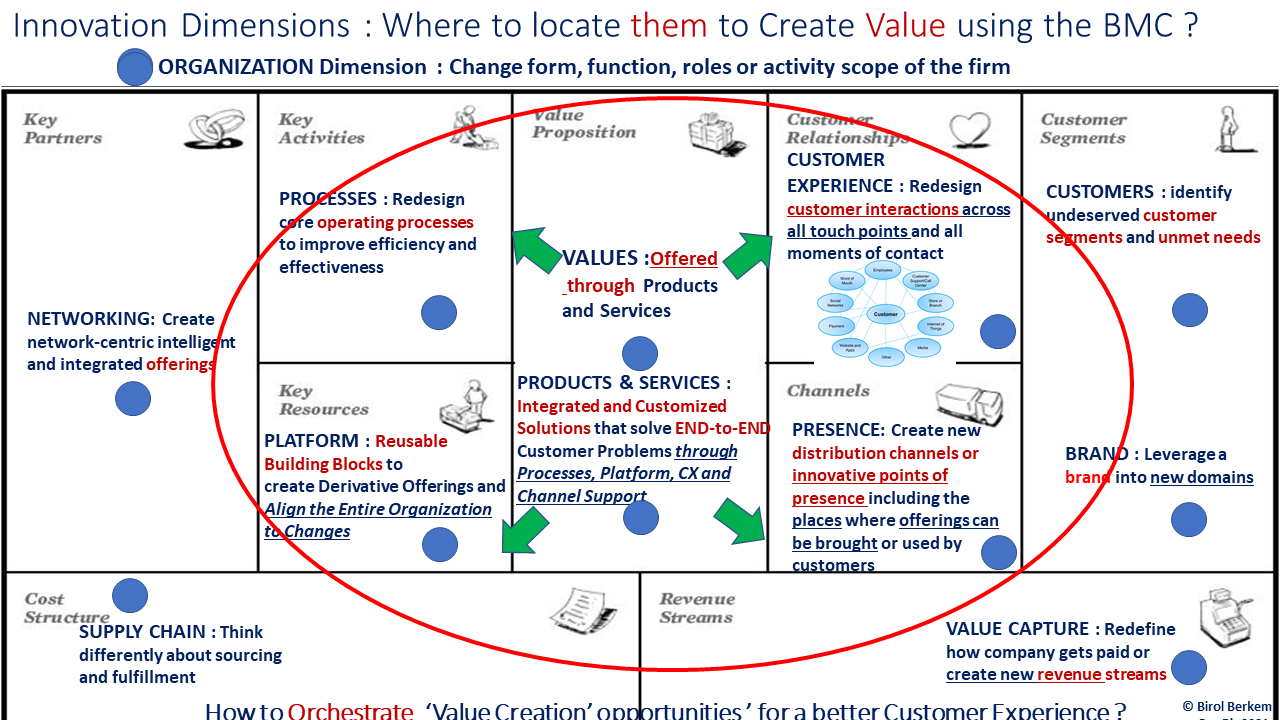
Figure 2.1 - Entities of Innovation Dimensions that need to be Monitored to Create and Deliver Value through partitions of the Business Model Canvas
The circular touchpoints shape in blue placed in the Customer Experience partition symbolizes all touchpoints such as Media, Social Networks, Call Center, Branchs, ...that need to be orchestrated to deliver a consistent user experience (cf. Touchpoint Orchestration for an Agile Architecture in O-AA).
Having done this initial presentation of innovation entities, we need to focus now on the usage of these entities in a Value Creating Enterprise being based on Captured Data and directed by Goals and Strategies.
In this perspective, the below questions need to be answered :
- where to start and how to orchestrate the Value Creation process and its Delivery from Captured Changes to Steps of the Customer Journey
- then how to route 'Insightful Data' collected being based on user / customer feedbacks back to Strategic Values for decision-making.
ORCHESTRATING THE 'VALUE CREATION and DELIVERY'
Rather than answering these questions separately, a holistic approach better explains the approach by establishing two bridges :
- a first bridge from "Drivers (that fuel the change) up to the Steps of Customer Journey" to deliver the planned values
and
- a second one based on Feedbacks captured from users/customers including the IoT systems.to help the decision-makers about the adjustement that are needed to operate on values to deliver.
The figure below depicts a high-level description of these steps.
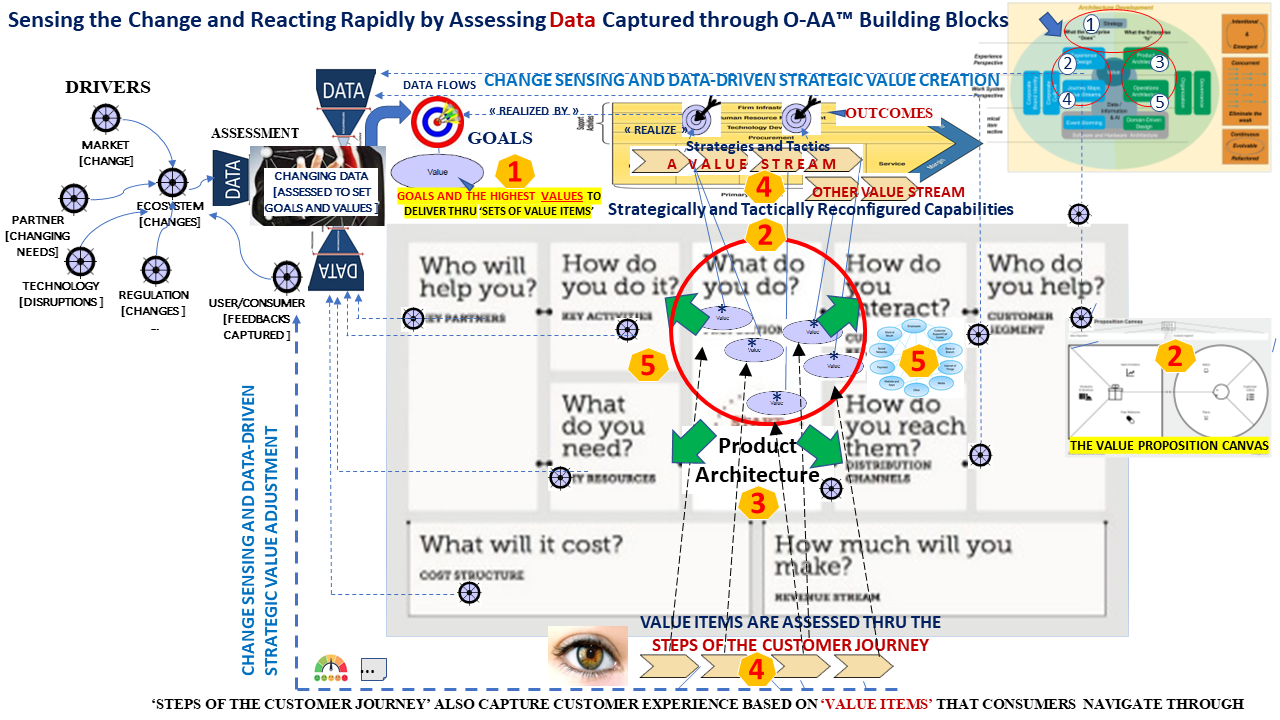
Figure 3 - A high-level description of O-AA Building Blocks to enable Strategic Value Creation and Value Adjustment being based on Data Captured thru Drivers
In brief, a Predictive ‘Value-Driven Development’ should normally start by setting goals and 'high level values' to be delivered through Stages of ‘Value Streams’ (the latter being suggested in TOGAF 9.2).
Modelling a Value-Driven Enterprise Architecture using ArchiMate 3 would help to determine step by step 'Value Items' that describe Value Proposition(s) on the basis of enterprise goals and unmet customer needs.
However, as indicated in the legend of the above schema, the coverage of the Strategy building block (1) goes beyond the goals and strategy settings by emphasizing on “experimental verification of strategic assumptions” using the business model for execution.
In this perspective, the Experience Design building block (2) focuses on client unmet needs and in particular on their undeserved pains and gains while doing their job to adjust the value propositions based on corresponding gain creators and pain relievers.
As a support to the Design Thinking Process, the ‘Value Proposition Canvas’ depicted below help to describe the ‘Experience Design’ through its ‘gain creators’ and ‘pain relievers’ to finally determine 'Value Items' (on the left) that need be offered to Consumers through the steps of their Customer Journey.
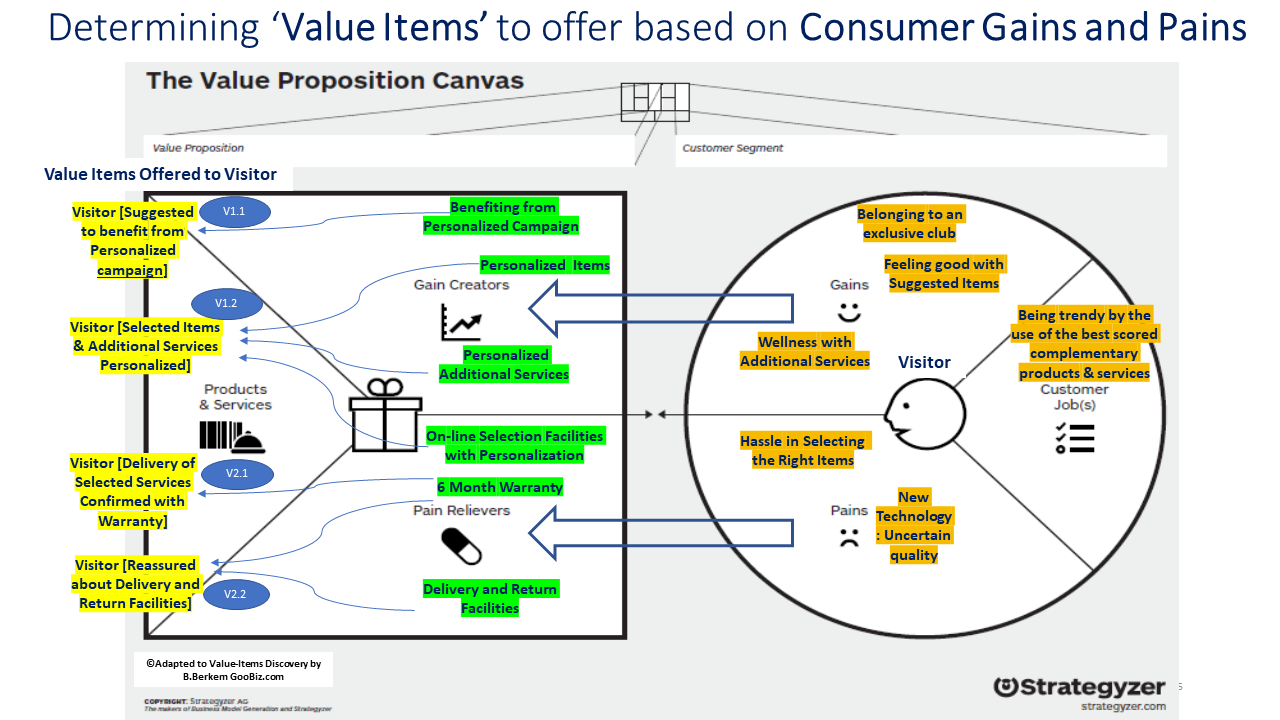
Figure 3.1 - The Value Proposition Canvas to support the Experience Design building block (2) of the O-AA by determining 'Value Items' that should be offered being based on undeserved gains and pains of Visitors
'Value Items' that are initially determined this way will serve respectively to :
- Step 3 : describe the Product Architecture that should support the corresponding design of products or services and
- Step 4 : discover potentially missing stages of Value Streams that are described through the ‘Operation Architecture’ (Processes, Resources, ...) - Figure 3.
In the perspective of the "experimental verification of strategic assumptions", Steps of the Customer Journey help to align Stages of Value Streams and Capabilities to establish the ‘Strategic Context’ for Value Delivery.
At run-time, user feedbacks and measures of KPIs captured in step 4 through the Customer Journey will be re-injected within the circuit of decision-making being accompanied by other data collected from external drivers (step 5).
The figure below shows an example of Value Stream where 'Value Items' found using the Value Proposition Canvas in figure 3.1 are mapped onto the Value Stream Stages to provide Visitors with a continuous value delivery.
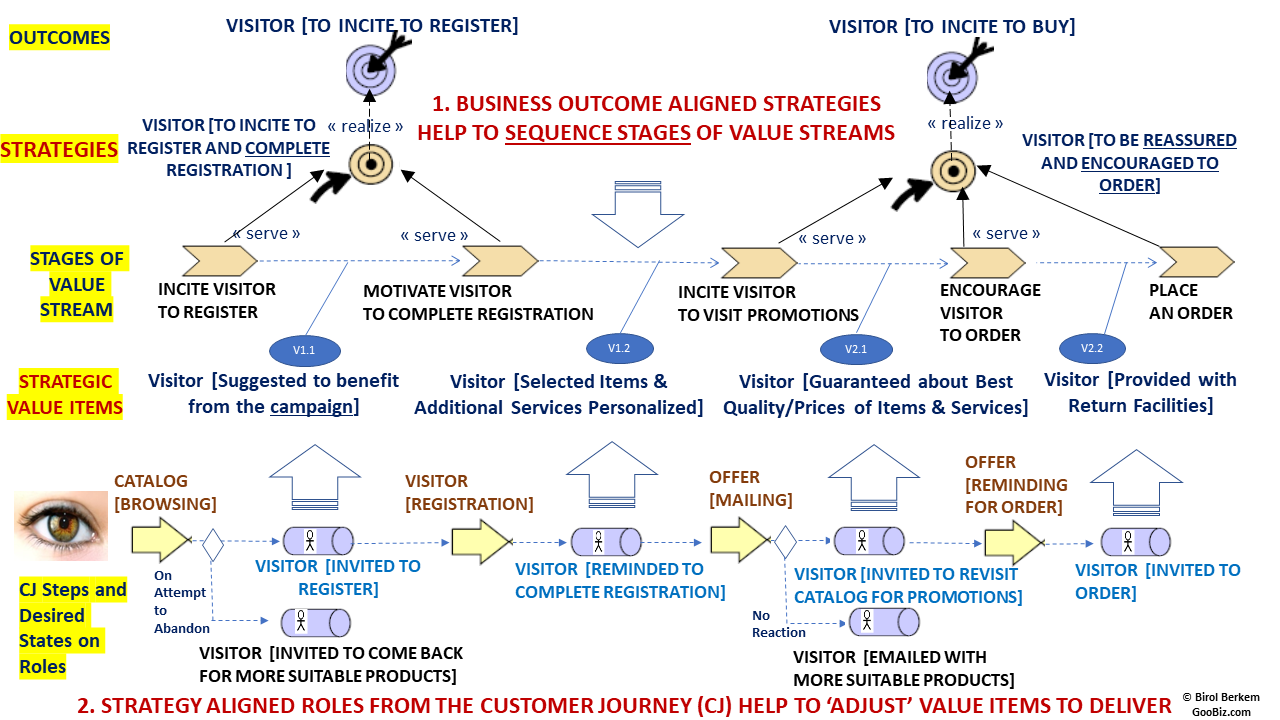
Figure 3.2 - Value Items and Value Stream Stages according to Strategies and Roles in the Customer Journey to ensure a Continuous Value Delivery
State-based Roles of the Customer Journey aligned with Strategies provide the ‘User Context ‘ within which User Stories should be triggered to deliver the corresponding Value Items.
The figure below depicts examples of formulation for User Stories that need to be triggered by such strategy aligned roles. The resulting user value request execution of the corresponding value-item.
The latter enables generation of insightful data at run-time to get customer feed-back from processes that correspond to the related stage of value stream.
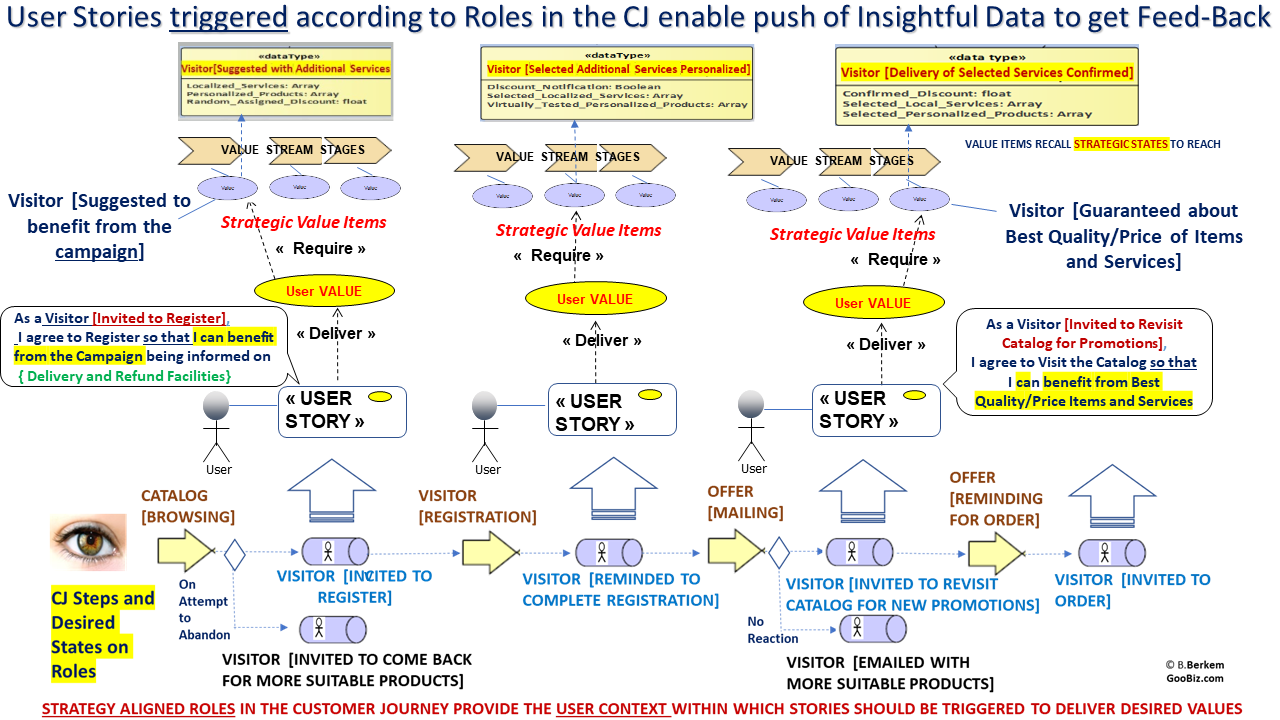
Figure 3.3 - Pushing Value-Driven Data to get insightful feed-back at runtime by establishing the bridge from Roles to Value Items via User Stories
MAKING THE VALUE CREATION AND DELIVERY 'ACTIONABLE' THRU THE STRATEGIC VALUE DEVELOPMENT CYCLE
To better formulate and then automate the complete process of 'Value Creation and Delivery' being supported by data, information and insight that need to flow against the elements of the architecture, let's take a look below into the ISO/IEC 2382 : 2015 standard that defines data and information then other sources referenced below.
In the ISO/IEC 2382 standard,
- “data” is used to represent “reinterpretable representation of information in a formalized manner suitable for communication, interpretation or processing” - data is the raw and unprocessed facts that are usually in the form of numbers and text [Dykes 2016].
- “information” is used to represent “knowledge concerning objects, such as facts, events, things, processes, or ideas, including concepts, that within a certain context has a particular meaning”. - information is prepared data that has been processed, aggregated and organized into a more human-friendly format that provides more context [Dykes 2016].
O-AA makes a summary of these definitions by stating that "Data becomes information when it is interpreted, when it has meaning" [O-AA - 2021].
By analyzing data and information to understand what is going on to draw conclusions with a particular situation, insights may be gained.
The latter can be used to make better business decisions by 'making strategies and corresponding values actionable using data' through the value development cycle being closely tied to the "context" created by high-level goals.
Indeed, to assist the decision-making using insights then adjust the strategically aligned value delivery, two essential questions need to be answered :
- 1) what precisely need to be the data to collect in order to avoid wasting with no productive insights and data such as those that just answer one particular question instead of answering all potential ones being aligned with enterprise goals and strategies,
- 2) when an insight is discovered, how to make it 'actionable' using data to deliver appropriate values to the organization and its environment ?"
To avoid wasting with no productive insights, the latter need to be aligned with potential facts that can happen in the course of realization of goals and underlying elements such as outcomes, strategies, tactics.
To deliver the right value based on such insightful facts, potential scenarios need to be envisioned and values to deliver in each situation should be planned to delight the user/customer step by step while reaching desired states planned by the hierarchy of enterprise goals till the operational data collection level.
In respect to these principles, the figure 4 below depicts the 'Cycle of the 'Strategic Value Development' with the following phases :
- Phase I - Preparing the Architecture for 'End-to-End Coherent Value Creation' and Making Value Items 'Actionable' based on Insights,
- Phase II - Leading to 'Value Delivery' by incorporating complementary knowledge from Innovation Dimensions about the 'How and When' to deliver Value,
- Phase III - Realizing the Value Delivery thru Steps of the Customer Journey and Capturing CX Data,
- Phase IV - Adjusting the 'Value Delivery' using Goal-Aligned Insights
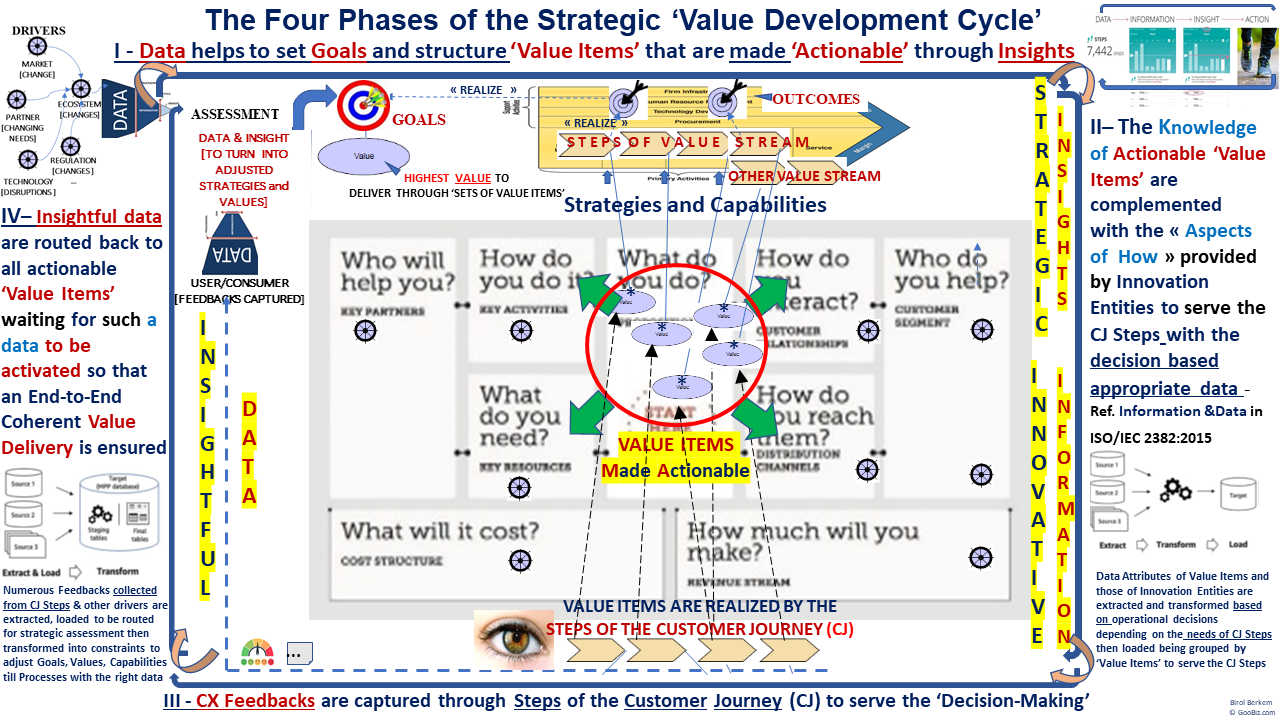
Figure 4 - Phases of the 'Strategic Value Development' to enable the 'Goal-Aligned Agile Value Delivery and Data-based Effective Decision-Making'
The 'Data-Information-Insight-Action icon' placed on the right upperside of the figure belongs to Brent Dykes [Dykes 2016].
We updated it using two arrows each of them enabling respectively :
- the Goal-Aligned Value Creation : using a forward bridge from 'Data to Action (on CJ steps)' that cover the needs of Phases I, II and III,
- the Data-Driven Value Evolution : using a backward bridge from 'Action to Data' that focuses on collecting user/IoT feedbacks through CJ steps (phase III) to get the 'insightful data' routed to adjust strategies and corresponding 'values' in phase IV.
Phase I - Preparing the Architecture for 'End-to-End Coherent Value Creation' and Making Value Items 'Actionable' based on Insights,
In this phase, data captured from different drivers (as depicted in figure 3) are assessed to structure elements of the architecture such as goals, outcomes... and 'value items'.
Then to enable an End-to-End Coherent Value Creation in a top-down hierarchy, elements of the architecture need to be formatted by specifying their Monitored Entity, 'Desired State' and means that should be used to reach this state.
Such a "goal-driven representation" of an architecture element implicitly creates a knowledge within which the change captured by its Monitored Entity provides direction in a given top-down hierarchy until covering operational roles and data.
In addition, formulating architecture elements using a state based representation of the knowledge brings "flexibility" facing change.
An architecture element (goal, outcome, value item, strategy or tactic, insight, information,...) expressed using a state based format can evolve by extending its state or by using additional means that constrain the 'value to deliver' as formalized below.
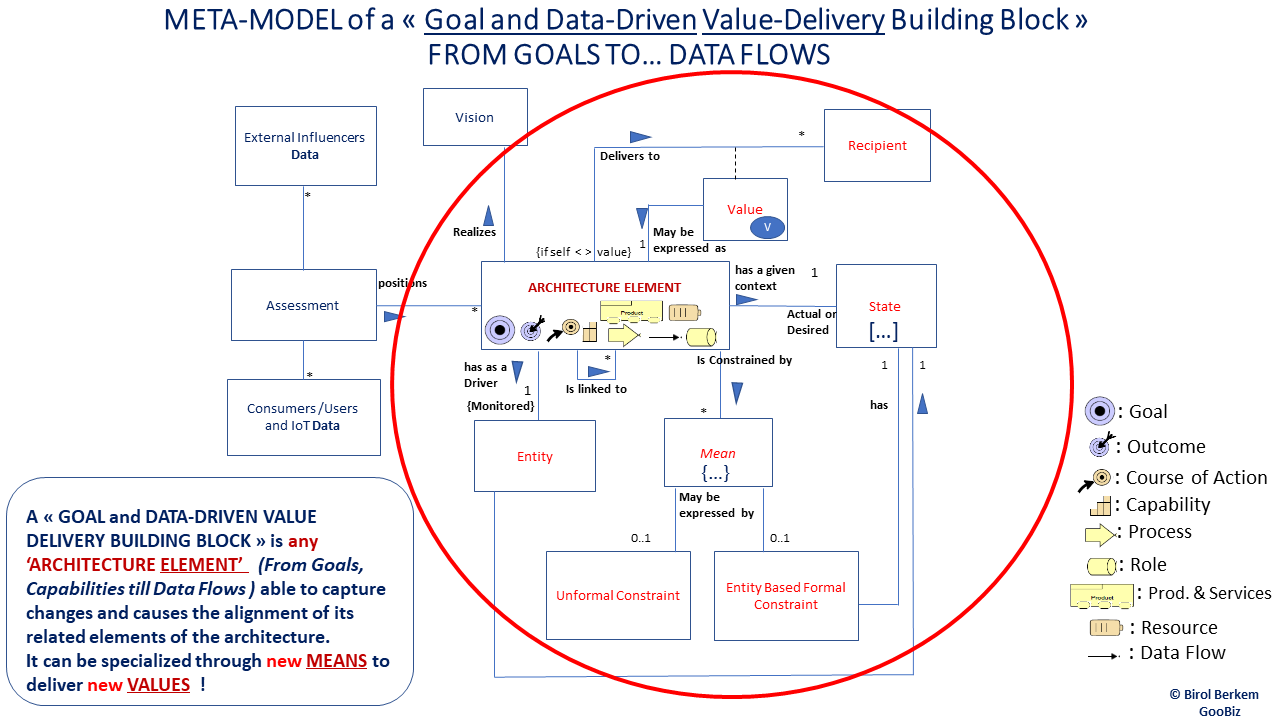
Figure 4.1 - Entities and Relationships of a 'Goal and Data-Driven Value-Delivery Building Block' to prepare the Architecture for 'End-to-End Value Creation'
According to the above meta-model, an example of 'Goal description' may be suggested as follows :
Goal : Visitor [To Turn into Buyer] {Constrained by the Means below}
'Benefiting from high quality Complementary Products and Services'
For example, in the case of a websale company's website whose goal is to 'Turn Visitors into Buyers', the latter may be expressed using the 'Visitor' with the Desired State [To Turn into Buyer]'.
This helps to align underlying Outcomes (that focus on partial realization of that goal) where the entity Visitor may be respectively assigned with Desired States expressed by Visitor [To Incite to Register] and Visitor [To Incite to Buy].
The decision table gives a detailed description of each Value Item per KPI based strategic scenario to align Operational Step(s) of the Customer Journey and Roles.
In this situation, if for example a constraint such as "Number of Registered Visitors should be at least equal to 20% of Visitors invited to Register" is applied as a mean to the outcome Visitor [To Incite to Register...], impacts need to be described as depicted in the table below.
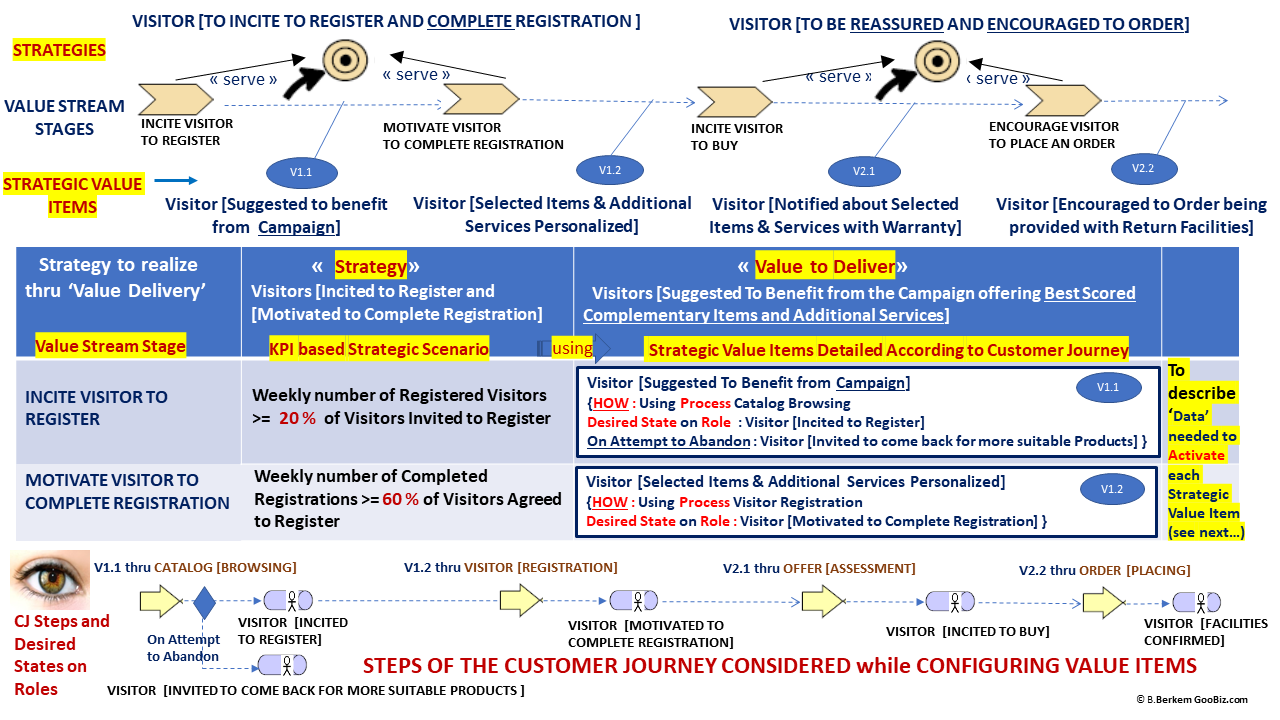
Table 1 - An initial representation of the 'Strategic Scenario Based Value Delivery' Decision Table with State Based Value Items
Such a declarative specification of 'Value Items' and Roles help to guide discovery of data attributes to ensure experimental verification of 'Strategic Assumptions'.
These aspects will be covered in phases II and III of the Strategic Value Development Cycle.
Phase I bis - Making Value Items 'Actionable' through Insights :
This is a sub-phase of phase I within which insights are formulated being closely tied to Strategy Scenarios to make strategies and the corresponding Value Delivery ‘Actionable’.
In this perspective', insights need to be formulated to enable 'scenario based realizations' of goals and strategies using some constraints (by setting values to their attributes).
Different 'execution states' that correspond each to a potential strategic scenario can be encountered during the realization of a strategy (formulated as a Desired State on a Monitored Entity using constraints).
For example, if a Strategy is provided for the entity Visitor using a 'desired state' expressed by [to incite to register] where a constraint is imposed by the targeted KPI set to 20% of Registered Visitors per week, different execution scenarios become potentially possible while the monitored entity tries to reach the 'desired state' expressed by the strategy.
Some of these strategic scenarios may be expressed by : Visitor [Agreed to Register], Visitor [Refused to register], Visitor [Abandoned during Registration], Visitor [Canceled its Registration], etc... each one followed by the 'means' that may constrain the attribute values of the scenario such as KPIs to enable its realization.
The Decision Table below, in an initial representation, depicts through its row 'Actionable Insight' a 'Strategic Scenario' aligned to the targeted strategy and KPIs (row 1, column 1). The corresponding 'Strategic Value' that need to be delivered by the 'Value Item' is provided in the 2nd column of the table. It is expressed using data attributes where actual data values are currently unknown.
For example, based on the strategy Visitor [To Incite to Register],with a rate of 20 % registrants a week, the insight that corresponds to the strategic scenario Visitor [Agreed to Register] {Ratio of Registered Visitors >=...} can help to determine performance data attributes such as (Market performance level, Visitor confirmed performance level, etc...).
These data attribute values will be provided by the operational process scenarios at runtime in Phase III (from Captured CX Data).
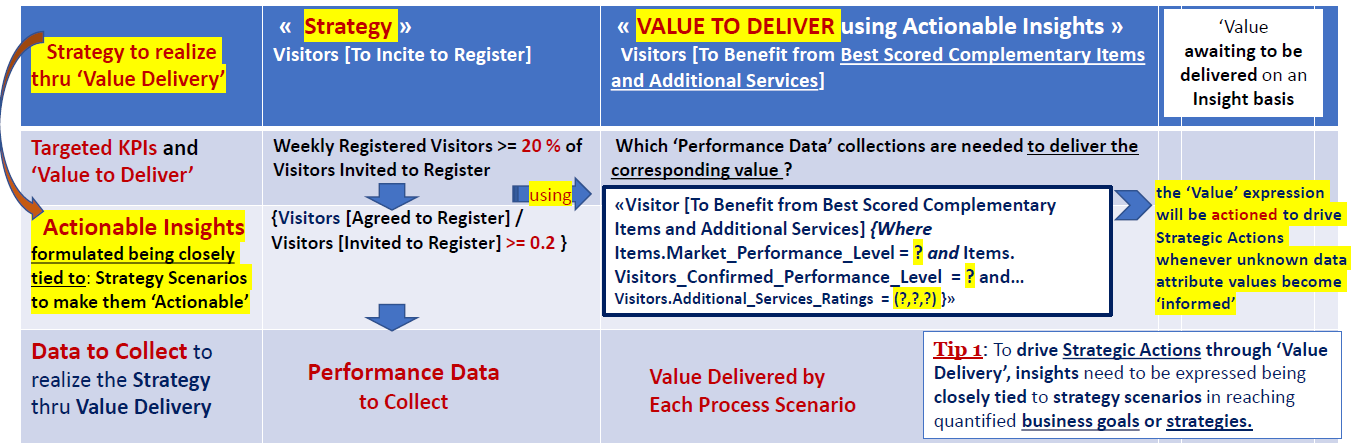
Table 1.1 - An initial representation of the 'Strategy Based Value Delivery' Decision Table' to Align Insights and Data with Strategies
Indeed, constraining a 'strategic value item' by applying a rule on it help to deliver the 'right operational data' through processes that realize corresponding strategies.
For example, a rule stating that " {for a product item to be scored "performant" on the website, the average market performance level need to be equal to 4]} can constrain the information delivered by this 'value item' - where level 4 might mean that "at least 80% of visitors have liked the corresponding product".
Making a 'value item' actionable by inserting such a rule within its 'context' (as depicted in the red circle below) help to filter the number of suggested instances / occurrences of offered products to adapt the 'delivered value' directly to visitors actual needs.
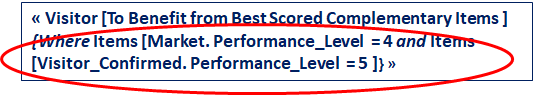
This may be realized by applying for example in the case of relational databases a "conditional join operator" using the rule expressed by "where Items.performance level = 4..." to fit with visitor expectations.
Further insights that cannot be predicted based on strategies but gained as outputs of the Phase IV will also be considered to adjust corresponding 'strategic values'.
Phase II - Leading to 'Value Delivery' by incorporating knowledge from Innovation Dimensions about the 'How, Who, and Where'
As mentioned in the paragraph 4.5.3 of O-AA,
"Continuous architecture facilitates incremental changes to the product or platform architectures".
The Continous Architecture principle can be applied here by complementing the knowledge of Values Items ('What to deliver') by the information provided from innovation entities of Customer, Organization, Activities and Resource Dimensions that focus on the means that are used in the aspect of "How to deliver that Value".
For example, a Visitor (as a subject where the value is to be delivered )
- may be 'suggested to benefit from' (Desired State of the Value)
- Best Scored Complementary Products (the resource entity referenced to support the Value)
- { through a Demo tool (software resource entity) based on Virtual Reality or Digital Twin tools ( technology resource entities referenced as part of the configuration of the Value)
- while browsing the Catalog (key activity that supports the value)}.
In this perspective, the above entities defined within the 'Repository of Innovation dimensions' have to be delivered as " instances " to serve the 'Value Item' in responding to aspects of "How to deliver it and where".
The figure below depicts through an example the support brought by the knowledge of instantiated Innovation Entities from the Business Model Canvas (BMC) to a given Value Item.
The Knowledge of ‘Value Items’ being complemented with the data brought by the « How, Who & Where » aspects of Innovation Entities allow them to be ‘configured’ according to the needs of each CJ Step.
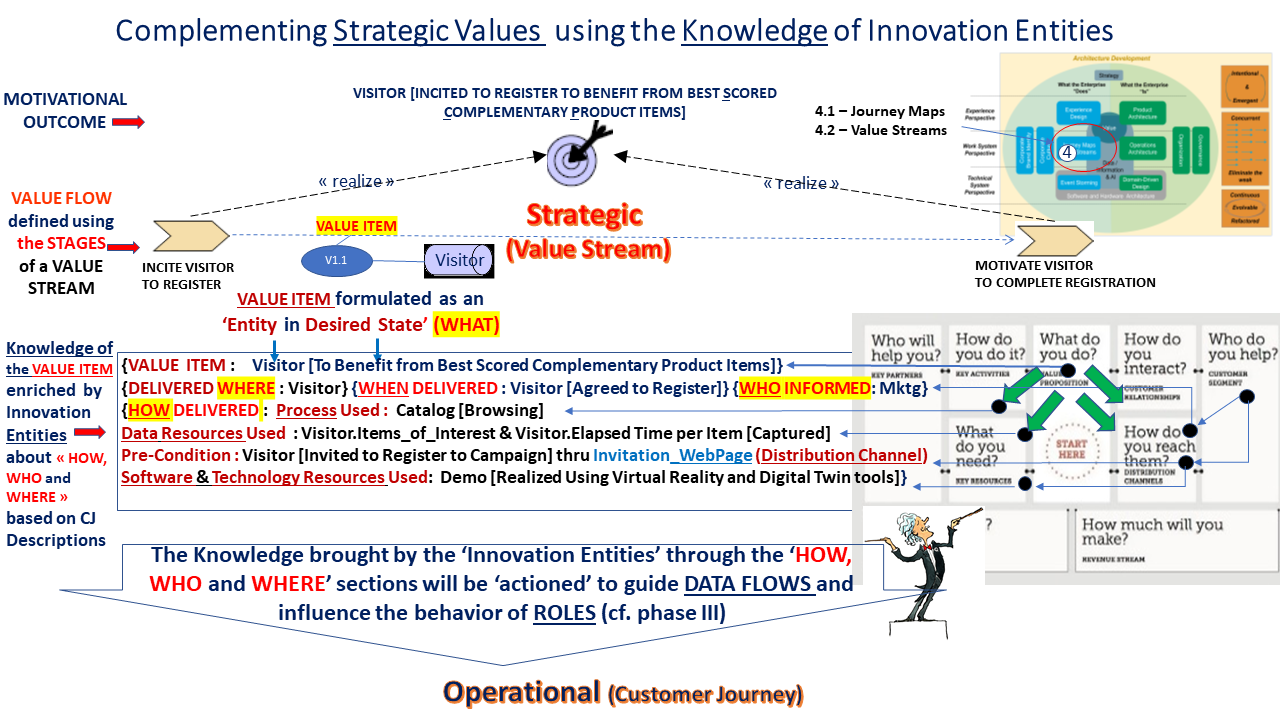
This may be concretized more formally using the 'Strategy and Value Delivery' Decision Table where a 'Value Item' is configured through instances of Innovation Entities and tested based on Desired States to reach as depicted below.
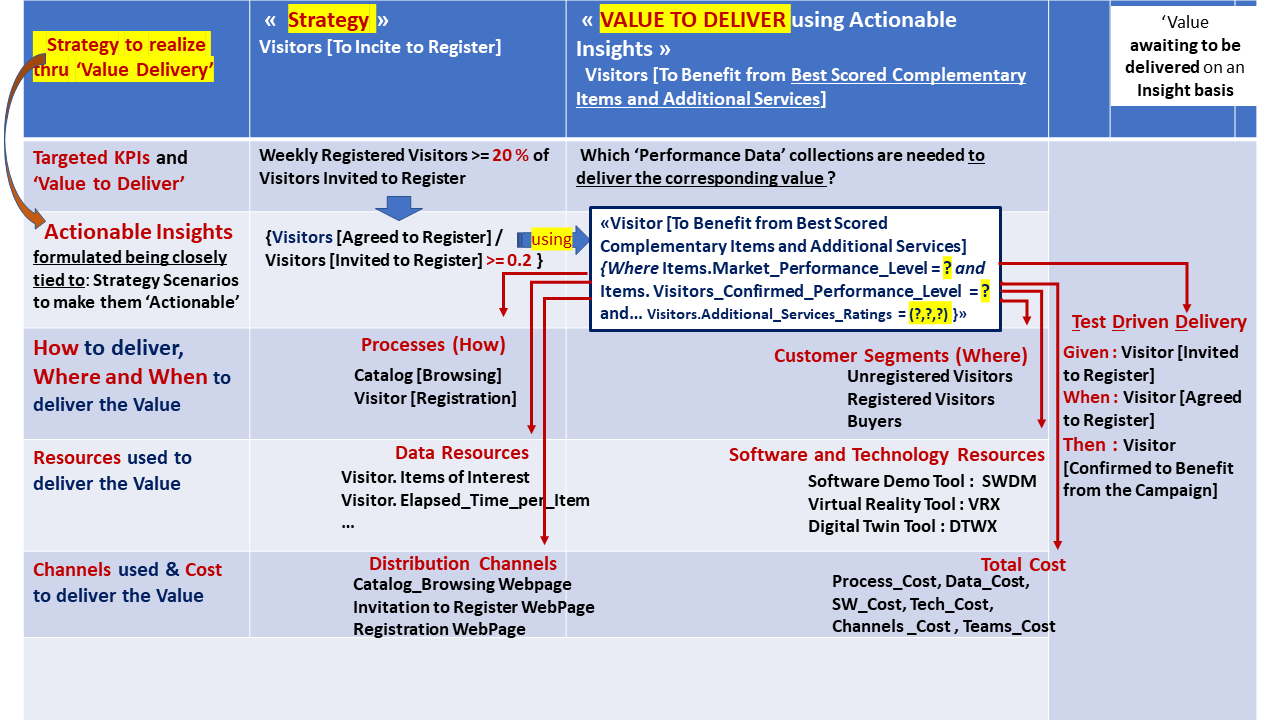
Table 2 - Decision Table used to Configure 'Strategic Value Delivery' through instances of Innovation Entities
Phase III - Realizing the Value Delivery and Capturing the CX Performance Data
In this phase, value items are delivered through steps of the Customer Journey (CJ) where CX and performance data are collected to enable the value-driven decentralized decision-making [Day-Schoemaker 2019] in Phase IV.
The 'Value Delivery' in this phase focuses on the impact that needs to be created upon operational elements such as Roles, Processes, Resources, etc...
This allows guiding the ‘Data’ to get routed toward entities of the Customer and Resource Dimensions where the 'Value Item' needs to be delivered then "monitor" the behavior of these entities through feedbacks along the steps of the CJ.
Such an informational alignment needs to be expanded until description of data attributes that need to be handled by the steps of the Customer Journey (CJ) to finally capture CX based feedbacks .
These feedbacks become "insightful" due to the deterministic formulation of each CJ step as an "Object in a given context (state)".
In this perspective, delivery of a 'value item' through steps of the customer journey makes necessary involvement of the following dimensions :
- 'Desired states' expected from Roles of 'Customer and Resource Dimensions' (human and non human resources), such as Visitor [Invited to Register] or Visitor [Agreed to Register] according to aspects of 'who and how' ,
- Key Activities and Resources needed to serve Roles with the right information based on the desired impact to be created on them, such as suggesting a demo to visitors about product items of their interest while inviting them to register,
- Distribution Channels including places where offerings can be brought for use by consumers.
The figure below depicts an example of alignment of the 'Data to collect' on a 'Strategic Insight' basis.
'Data Attributes' mentioned in the expression of the strategic 'Value to Deliver' (1) are awaiting to be informed at runtime based on data needed for its different scenarios (basic, exception, output).
At the operational level, for each strategic scenario, different operational process scenarios need to be determined (basic, exception, output).
Each of them is expressed by a couple of 'Performance Data to Collect and Value to Deliver' through process scenarios (2nd column of the below table) on a data basis (4th, 5th and 6 th row of the table).
Indeed, to align process scenarios to strategies, each scenario sets its appropriate 'value to deliver' in order to contribute to the realization of the strategic insight.
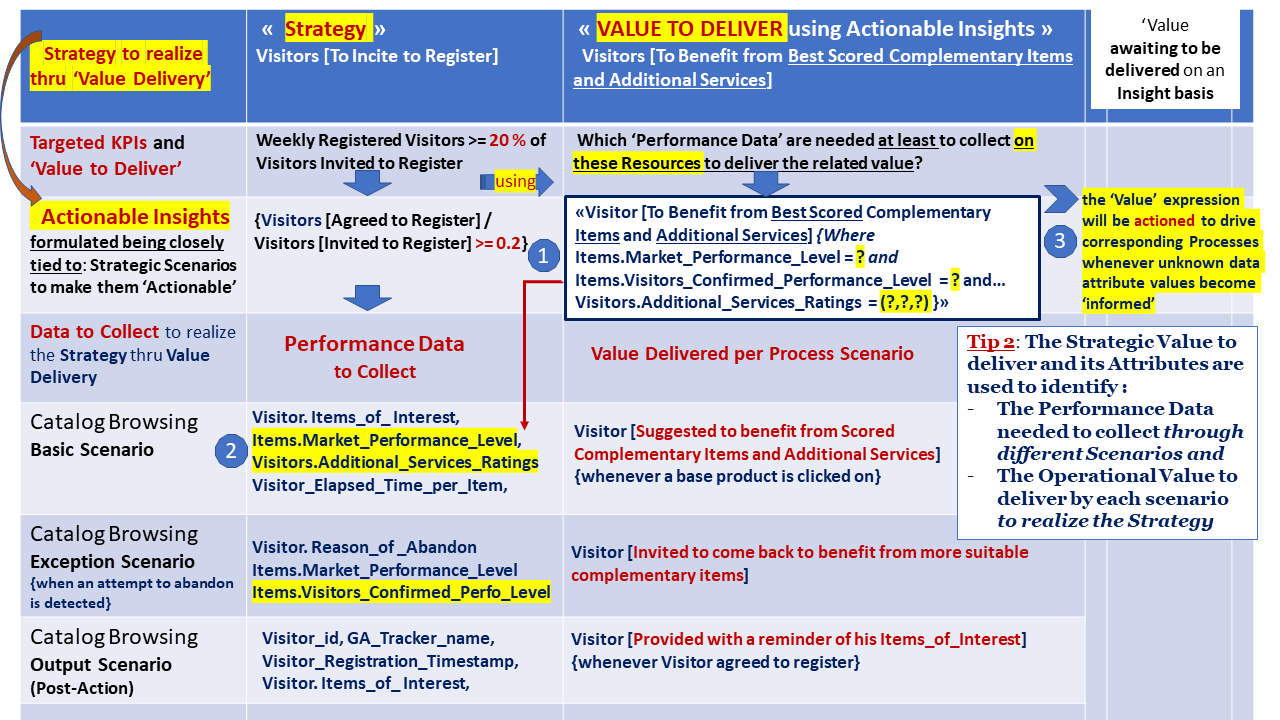
Table 3 - 'Insight based Value Delivery' Decision Table to Align Data with Goals and Strategies - Performance data that are needed to deliver an Insight based Value Item (1) are used to determine data attributes to collect through different operational scenarios (2)
In the example, during the execution of the Catalog [Browsing] process, visitor feedbacks about suggested product items and user behavior are collected. This is done on a scenario basis using data attributes such as Visitor.items_of_interest, elapsed_time_per_item (in the basic scenario), reason_of_abandon, suggested items_score_level (through the exception scenario), etc...
The right part (3) of the figure depicts the 'delivery of the actionable value item' based on data attributes once the latter is valued based on feedbacks (cf. Phase IV).
Enabling CX 'Data Feedbacks' for Strategic Decision-Making
As mentioned in the introduction paragraph, the Value-Driven Intentional Architecture needs to be updated based on emergent facts such as new trends of the market as well as feedbacks collected from users and customers about all kind of performance aspects that provide the basis for an evolutionary and incremental implementation (Emergent Architecture Design).
The figure below shows three strategic contexts expressed by 2nd level Capabilities namely Visitors [Inciting to Register], Visitors [Motivating to Complete Registration] and Visitors [Inciting to Buy].
Inside each context, data flows (highlighted in yellow) serve consumer roles by providing them with the 'Strategic Value' at the operational level.
Feedbacks about additional services captured from consumers through 'Attributes of Data Types' are 'traced back' to "data flow" objects.
This helps to include these additional services in the evaluation of business objectives that need to be met by Scenarios of Strategic Insights (cf. Strategy vs. Value Decision Table in Phase IV).
The motivation here in capturing CX data is to serve strategy-aligned insights to activate their 'value delivery' as described in Phase IV for Decentralized Decision-Making.
In this perspective, the bottom part of the figure depicts data attributes that are conveyed to the role Visitor through data flows according to value-items they realize at the operational layer.
In the figure below, the first two data types on the left may be useful for the Marketing Unit whilst the last one can serve the decison-making in the Sales Unit.
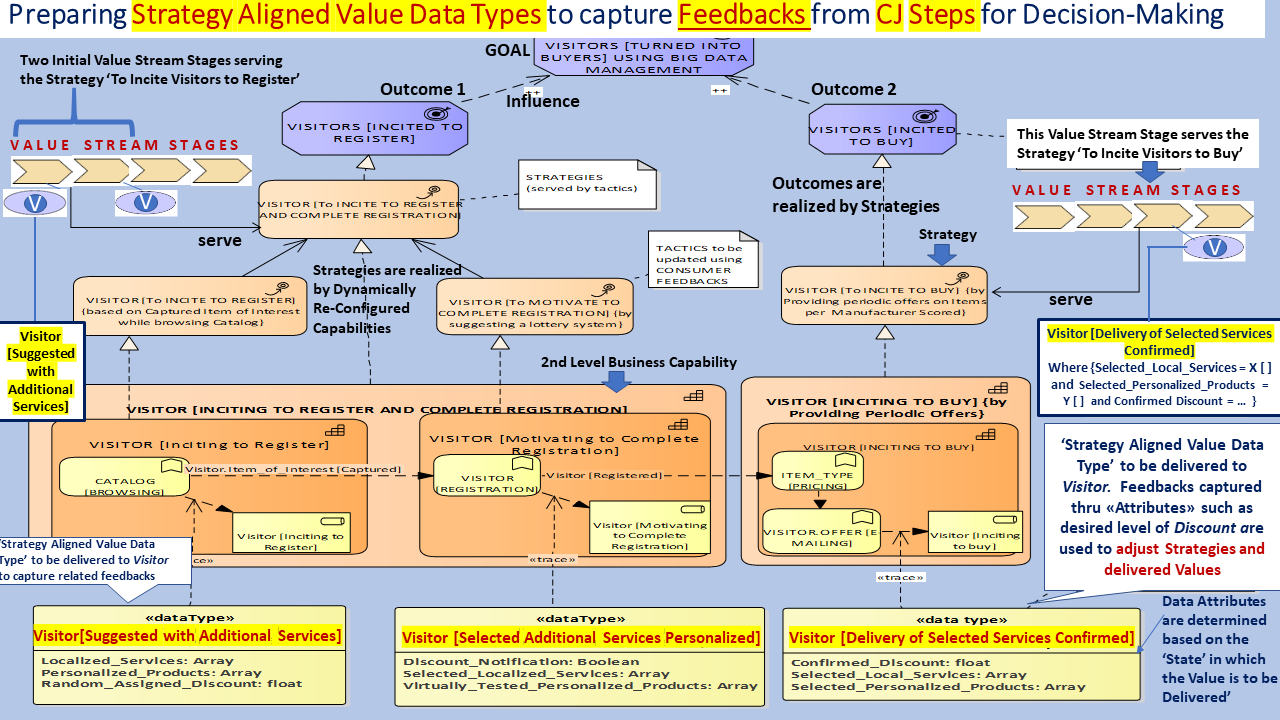
Figure 5.1 - Data-Types used to Capture Consumer Feedbacks on a 'Value Item' basis to serve Decentralized Decision-Making respectively in Marketing and Sales Units (cf. Phase IV)
Generating 'Strategy Aligned Value Data' through User Stories according to the Role and the 'Value Item' that need to be served
The figure below shows how to prepare and publish the previous Data-Types in Phase G of TOGAF ADM to the corresponding Step of Customer Journey in order to enable related feed-backs for Decision-Making.
Figure 5.2 - User Stories publishing Stateful Data-Types on a Role basis through corresponding 'Steps of Customer Journey' to capture Consumer Feedbacks at run time on a 'Value Item' basis
Phase IV - Adjusting the 'Value Delivery' based on Goal-Aligned Actionable Insights (TOGAF ADM's Phase H)
As mentioned in the introduction, 'Value creation and delivery' must be adapted to changing needs of consumers and the organization's disrupting environment.
In this perspective, insightful data captured based on consumer feedbacks need to be used to adjust the value delivery by actioning the corresponding 'value items'.
As depicted in the 'Strategic Insight vs. Value Delivery' Decision Table below, to adjust the 'value delivery' based on the needs of consumers, data collected on (1) for each process scenario (basic, exception, output) are used to inform 'Value attributes' of the strategic insight (2) to drive strategic actions (3).
At run time, this makes the strategic insight actioned (3) as explained in the next paragraph.
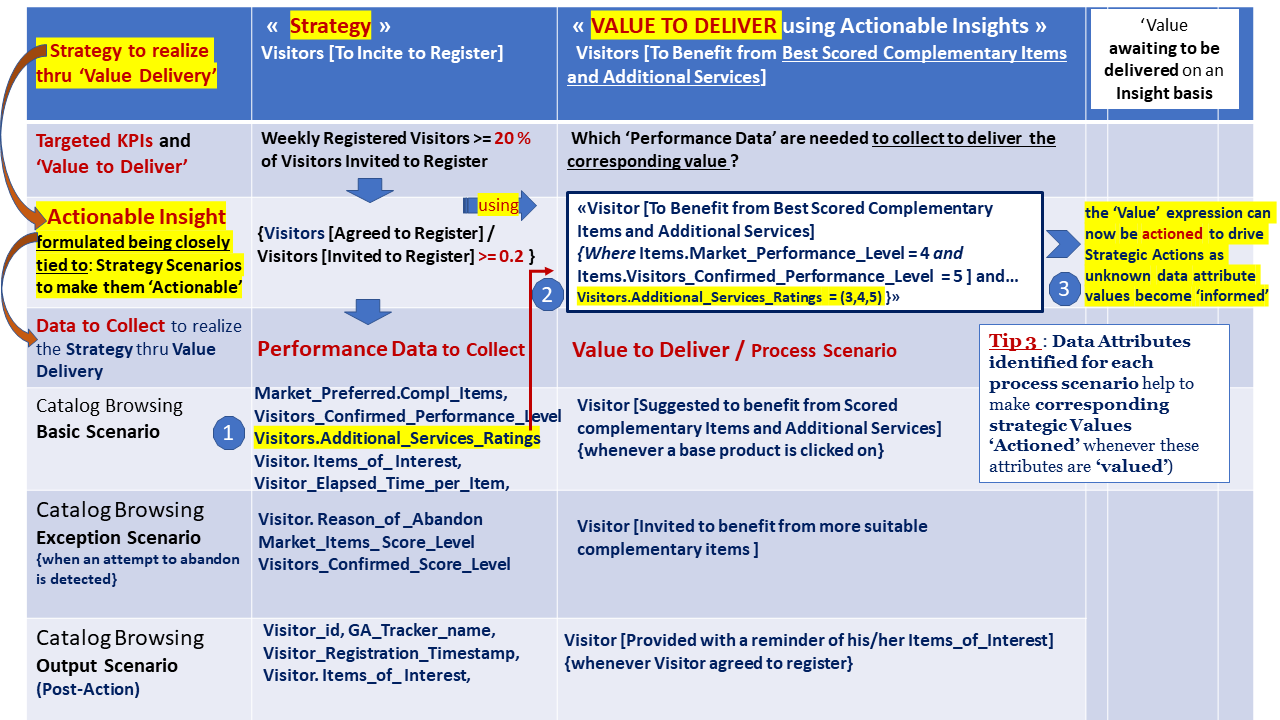
Table 4 - 'Strategic Insight vs. Value Delivery' Decision Table to Activate Strategy Aligned Insights to deliver adjusted Values
As a reminder, In Phase III, consumer feedbacks about suggested additional services were captured through 'Attributes of Data Types'.
In the above Decision Table, these data feedbacks are summarized by the Additional Services Ratings attribute (1) in the Catalog [Browsing] scenario (Row 4,Column 1). Then the collected data is carried to the cell 'Value to Deliver' (Row 2, Column 2)' to be finally injected into the context of the Value expression (3).
Thus, the latter can be 'activated' to drive strategic actions through its performance level data collected based on its basic, exception and output scenarios to ensure a 'responsive value delivery' to consumers as explained in the next paragraph.
Routing 'INSIGHTFUL Value Attributes' to enable the Decision-Making
This subparagraph focuses on revisiting strategies, tactics and capabilities based on user/consumer feedbacks to offer a coherent evolution to the system through its processes.
In this perspective, the figure 6 below depicts through an example how to route 'Insightful Data' throughout the Strategy Layer in the ascending direction from operational processes to update strategic values to deliver.
This is to align all 'value items' delivered by different strategic nodes (courses of actions) according to their due alignment with consumer feedbacks and high-level motivation elements (goals, outcomes, value streams...) that need to be revisited.
Ensuring Coherent Evolution in assisting the Decision-Making
To ensure a coherent evolution, a data collected from different operational scenarios should serve all value items that are waiting for such a data to reach their 'desired states'.
In the example below, during the first step of the Customer Journey where visitors come to browse Product Items through the Catalog of on the company, analytics revealed that abandons on the webpage were mainly due to the fact that visitors are more likely interested in 'Better Scored Performant Complementary Items (with Score level = 4)'.
The insight is then routed back to all strategic nodes located in the hierarchy of the goal 'Visitors [Turned into Buyer] ' to activate Value Items awaiting such a data for their Items_Performance_Level.
Such an informational update of strategic nodes obliges operational processes that realize these strategies to get ‘notified’ with the required data (‘a collection of Complementary Items with Performance Level Score = 4’) and Additional Services 'Rated' by Visitors.
Thus, the steps of the 'customer journey' depicted on the bottom part in the figure become now able to suggest visitors with the corresponding product items of level 4 and additional services then confirm them respectively while inciting visitors to register and inciting them to buy through their contextual scenarios.
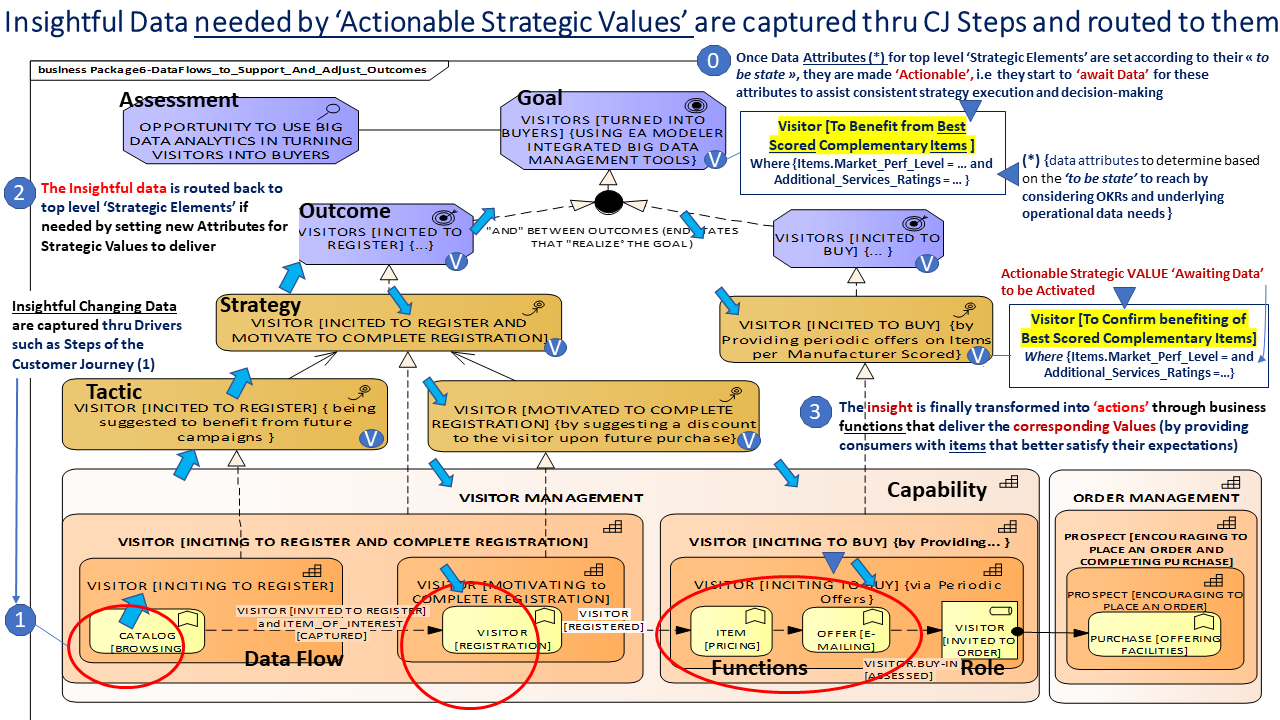
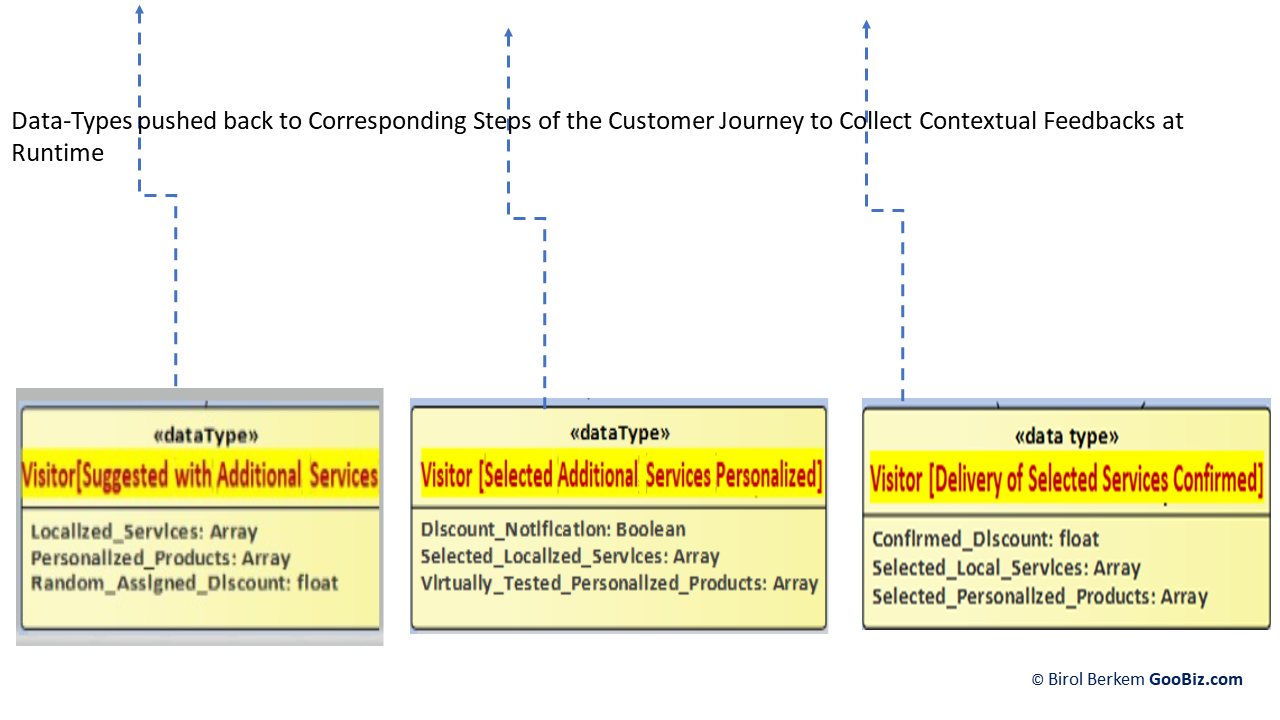 Figure 6 : Routing Insightful Data throughout Strategic Values awaiting this data to be activated to serve underlying Steps of the Customer Journey better meet consumer expectations
Instances of Value Data Types “pushed” back into the Steps of the Customer Journey (step 1 in blue) help to capture Consumers ‘State based Feedbacks' at run time to assist decision-making on possible Strategic Value Adjustments to better meet consumer expectations (steps 2 and 3).
At the end of this phase, a new cycle of Strategic Value Creation is initiated (as explained in Phase I bis).
MAPPING INNOVATION ENTITIES and ELEMENTS of the INTENTIONAL ARCHITECTURE TO AGILE TEAMS
O-AA defines the Business Agility as "the ability to quickly identify and respond to market and environment changes".
Enterprises need to "develop business agility when they sense changes in their environment early and act upon them decisively and rapidly".
Business Agility is about organizations learning to be capable of evolving rapidly.
On the basis of previous traceability relationships examined between concepts of the Agile Value-Driven Development, we have got now all materials necessary to make the mappings of assignments to Teams in an Agile Organization.
A complementary illustration of such an assignment relationships to Competency Teams and Product focusing 'Stream-Aligned Teams' respectively based on Innovation Entities and Value-Delivery Intentional Architecture can be found in the last schema (figure 9) on Making_The_Agile_Value_Driven_Architecture_Actionable
THE METAMODEL OF THE DATA-DRIVEN AND STRATEGY-BASED VALUE DELIVERY
The schema below depicts an overview on the Concepts and Relationships of the core part of the Actionable 'Data-Driven and Goal-based Value Delivery' approach by focusing on Customer Relationships and Delivery Channel Dimensions (described in figure 3) to collect planned vs. real-time customer data.
'Value Item Properties' and Insight are still to be added to the model in order to respectively guide Data and Roles at the operational layer based on Desired States of Innovation Entities and make Insights Actionable.
On the right part, some examples of Data Attributes are depicted to compare 'Expected Strategic Values to Deliver' and 'Real Customer Experiences' to assess them as part of the Customer Journey and take appropriate corrective actions.
Indeed, such data help to assist the decision-making by aligning Goals, underlying Value Streams and Courses of Actions (Strategies and Tactics).
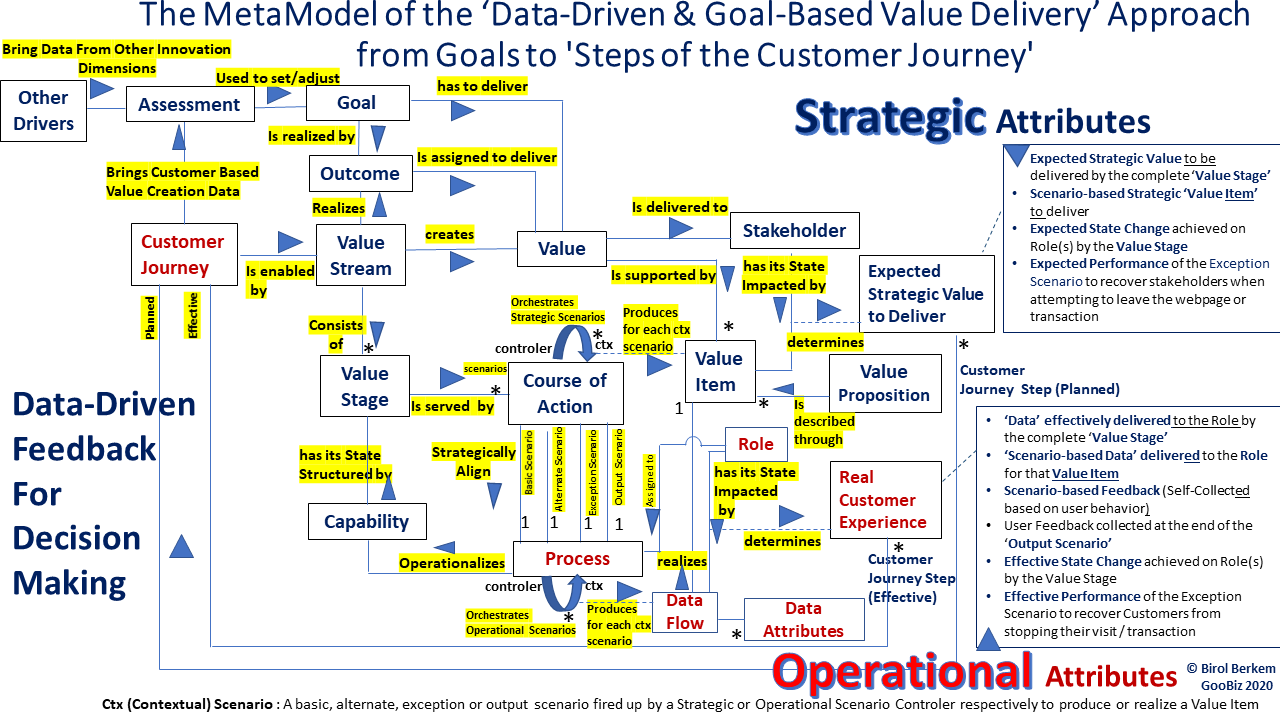
Figure 7 : The Meta-model of the 'Data-Driven and Goal-based Value Delivery' approach that focuses on the creation of Values from Goals to Steps of the Customer Journey with examples of "Data Attributes" whose actual values need to be captured and compared to planned ones for decision-making.
The ‘Architecture Element’ provided in the above metamodel may be any architecture element from ‘Goals till Operational Data Flows’ designed to create Value as explained in the first meta-model entitled “Meta-Model of the Value Delivering Architecture Building Blocks’ initially introduced in Phase I.
GLOSSARY OF TERMS
- Customer Journey (CJ). The customer journey describes the complete sum of experiences that customers go through when interacting in a path of sequential steps with an organization before and after purchasing a product or service. However, customers may decide to switch from one value stream to another during their journey or put their current CJ step in pause.
Therefore, to delight the customer by ensuring an easy navigation through steps of the customer journey, the system has to keep track of the 'last state achieved' by the customer. This aims to increase fluidity of the navigation when the undecided prospect switches between different value streams before attempting the final stage.
- Value Stream. A value stream represents a sequence of activities that create an overall result for a customer, stakeholder, or end user (ArchiMate 3.1). A value stream describes how an enterprise organizes its activities to create value. As described in the TOGAF Series Guide: 'Value Streams' - "a key principle of value streams is that value is always defined from the perspective of the stakeholder – the customer, end user, or recipient of the product, service, or deliverable produced by the work".
The value stages composing a value stream create specific value items. In the TOGAF Series Guide: 'Value Streams' and the BIZBOK Guide, stages of a value stream produce value items that are aggregated into an overall value proposition (this can be modeled in ArchiMate using aggregation relationships) and the entry and exit conditions for each stage are specified explicitly (modeled using ArchiMate constraints).
In ArchiMate, Value streams are typically realized by business processes. One business process may realize multiple stages in a value stream.
A value proposition is derived from a value stream (artifacts within business architecture that allow a business to specify the value proposition for a customer or internal stakeholder of an organization).
- Value Proposition. “A value proposition is a promise of value to be delivered, communicated, and acknowledged. It is also a belief from the customer about how value (benefit) will be delivered, experienced, and acquired” A value proposition is made of one or several products or services.
Structuring O-AA's Agile and Digital Enterprise based on TOGAF's ADM Phases please click here
References :
[Day-Schoemaker 2019] "See Sooner, Act Faster": How Vigilant Leaders Thrive in an Era of Digital Turbulence - George S. Day and Paul J. H. Schoemaker, October 2019]
[Dykes 2016] "Actionable Insights: The Missing Link Between Data And Business Value "
[O-AA 2021] :Value-Driven Agile Approach :
https://pubs.opengroup.org/architecture/o-aa-standard/architecture-development.html
https://pubs.opengroup.org/architecture/o-aa-standard/bb-overview.html
Birol Berkem, Ph.D - GooBiz - Paris, Last updated 2022 October 11 th
#businessmodelinnovation #valuecreation #digitaltransformation
